Anchor

US solar installations surge as federal tax credits begin phasing out
Built World11.4 GW added in Q2 2026, a 45% jump — utility-scale projects raced a July 4 safe harbour deadline
Today: SEIA report shows record Q2 surgeNew here? Follow stories to track developments over time. Create a free account to get updates when stories you care about change.
Overview
Updated 4 hours agoThe US added 11.4 gigawatts of solar capacity in the second quarter of 2026 — a 45% jump from a year ago and the market's strongest quarter in years. Nearly all of it was utility-scale: developers rushed to start construction on large solar farms before a July 4 deadline stripped federal tax credit eligibility.
That deadline was the safe harbour cutoff written into the One Big Beautiful Bill Act, which phases out the investment and production tax credits that made US solar economics work. Wood Mackenzie estimates more than 200 gigawatts of projects were grandfathered in; the US now runs about 300 gigawatts of solar, enough for roughly 50 million homes. The same law ends the subsidy era — residential installations are at a five-year low, and new tariffs on solar components take effect in December.
Why it matters
The last big federally subsidized solar rush has passed. Whether US clean power can keep growing without tax credits now gets tested.
Questions about this story
Free account needed to ask — your question is kept and asked for you right after sign-up. Answers are public.
No questions yet — be the first to ask.
Key Indicators
11.4 GW
Q2 2026 solar installations
Up 45% year over year and 43% from Q1, per SEIA/Wood Mackenzie.
45%
Year-over-year growth in Q2 2026
The sharpest quarterly gain in recent years, driven by the safe harbour deadline.
61%
Utility-scale year-over-year growth
Utility-scale projects delivered 9.6 GW of the 11.4 GW quarterly total.
>200 GWdc
Safe harbored project pipeline
Wood Mackenzie estimate of capacity grandfathered before the July 4 deadline.
~300 GW
Operating US solar capacity
Enough to power about 50 million homes, roughly one-third of US households.
Related Media
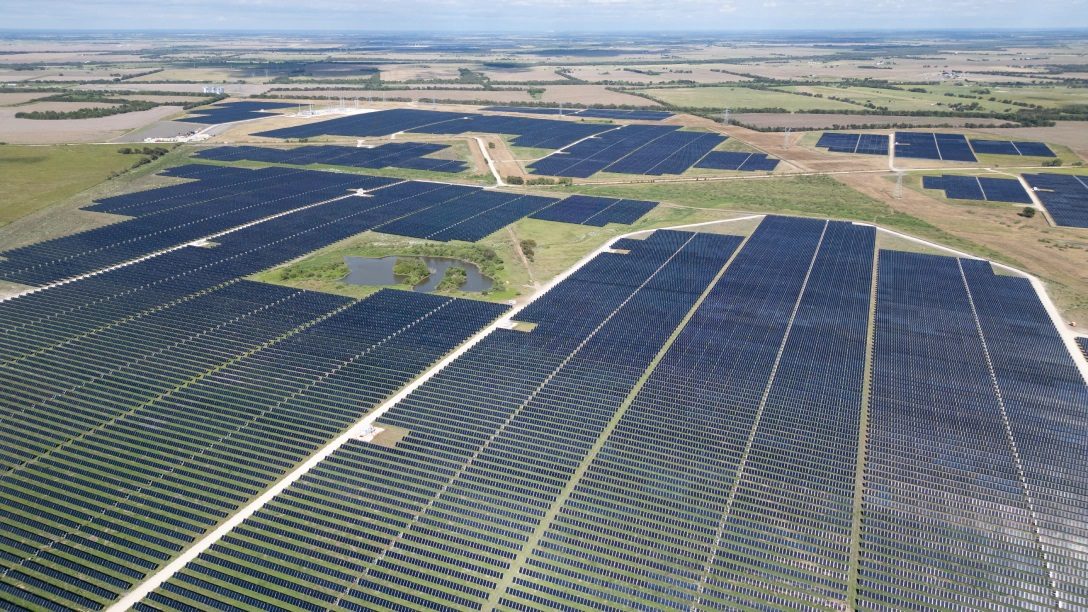
First Made-in-USA Solar Plant Set to Power Google Data Centers, Boosting Local Economy and American Manufacturing | Department of Energy
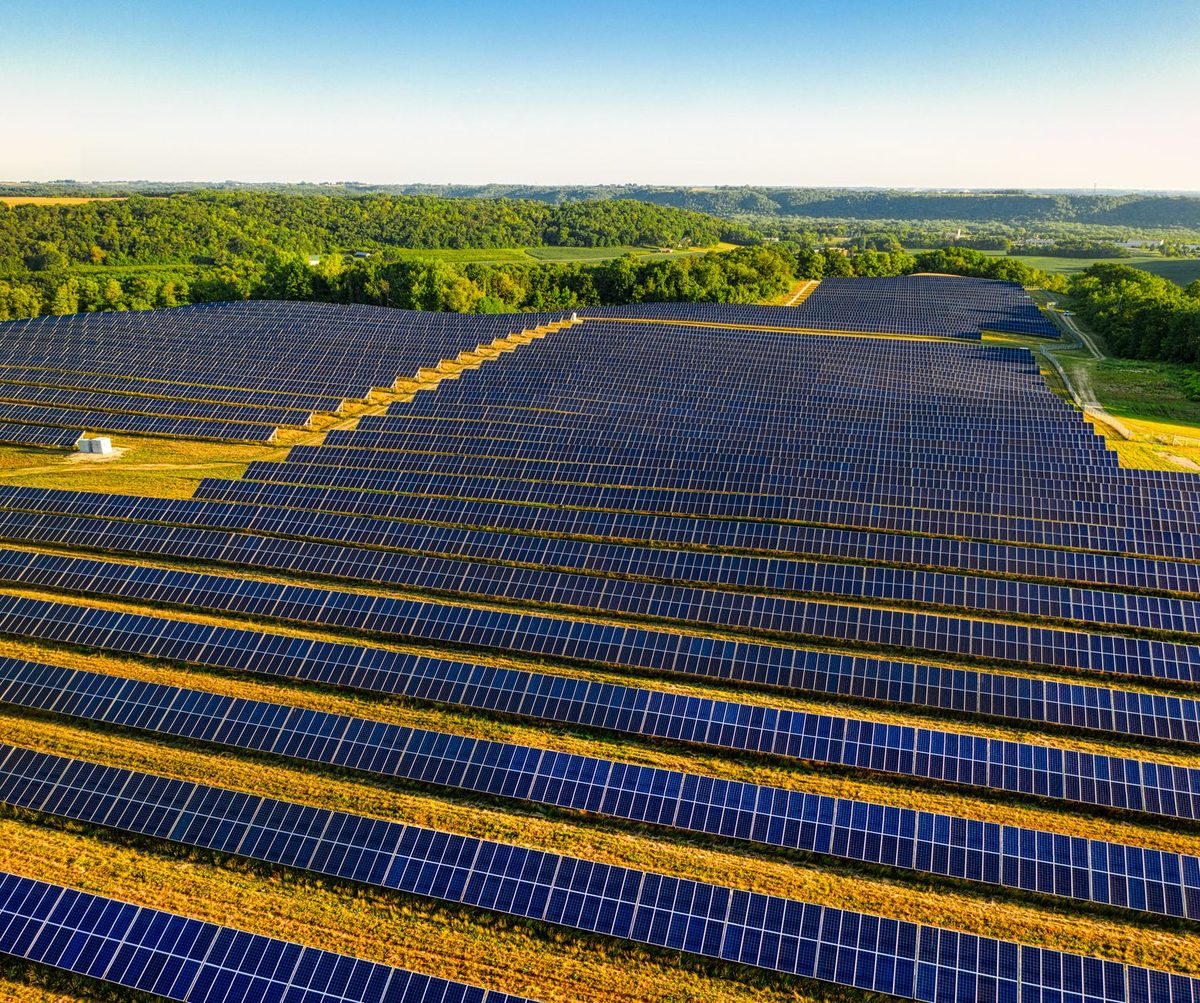
Aerial view of a vast solar farm in Red Wing, MN, generating renewable energy.
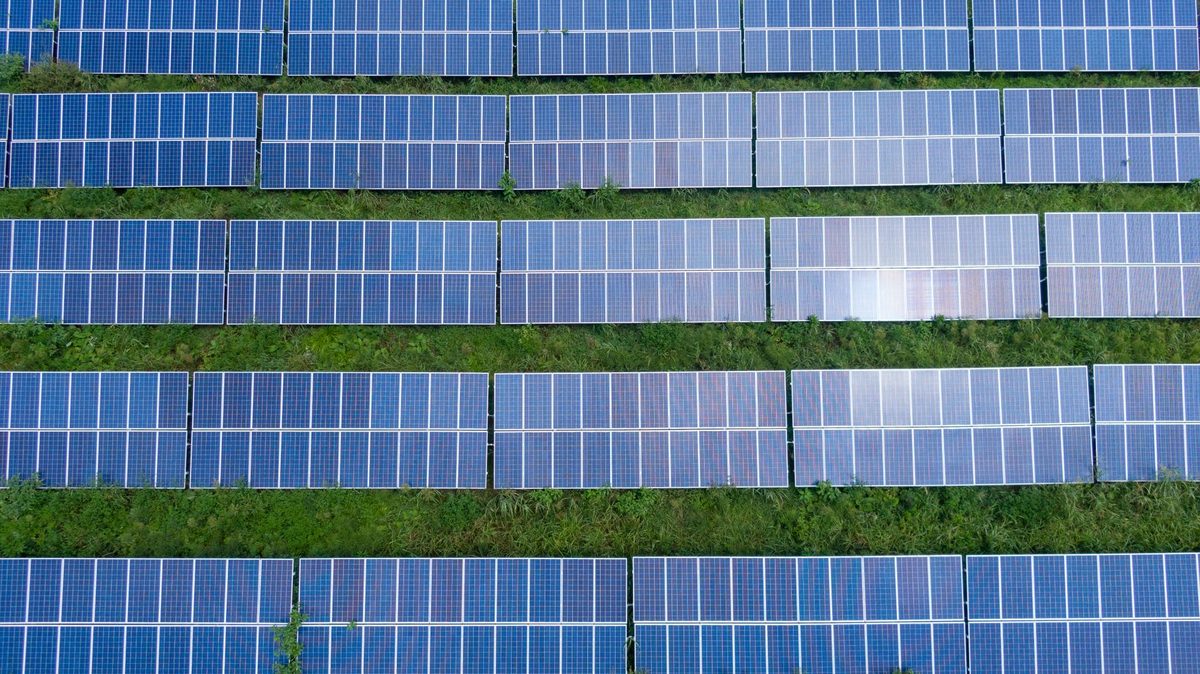
Aerial shot of a solar panel array generating renewable energy in Trenton, Georgia.

1.3K views
28:14
Battery Tax Credits Are Rewriting US Solar Economics
Bloomberg Podcasts
37 views
3:08
Popular federal solar incentive coming to an end
WCAX-TV Channel 3 News
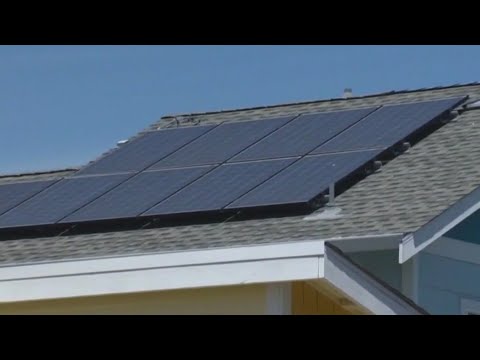
829 views
4:37
Solar tax credit ending early creates urgency for homeowners, ...
FOX 32 Chicago
Images from Openverse under Creative Commons licenses. Videos from YouTube.
Voices
Curated perspectives — historical figures and your fellow readers.
Play
Exploring all sides of a story is often best achieved with Play.
Most of these play right now — no account needed. Sign up to save scores, keep a streak, and unlock Debate and Predict.
Log in
Sign Up
Higher or Lower
A number from this story, against one from elsewhere in the news — guess which is bigger, then keep the chain going. 5 rounds, 3 strikes; a miss costs a strike and resets your streak.
Example
Anchor
EU tariff revenue
$52B
Big for this kind of number
Mystery
Pentagon AI contract
?
Round 1
Streak: 0
Mystery
?
Keyboard: ↓/L lower · ↑/H higher
0 pts
Best streak: 0 · Rounds: 0
0 points — sign up to put that on the leaderboard.
Now try on this story
Connections
Sixteen names from the news. Find the four hidden groups of four. Four mistakes max.
Loading today's puzzle…
0/4 groups
Mistakes
Sign up to keep a daily streak — a new puzzle lands every day.
Now try on this story
Exit debate?
Your progress in this debate will be lost.
How it works
- 1 Two AI personas square off on this story.
- 2 You predict who'll win each round — correct picks earn XP.
- 3 One crossfire question is yours to fire. Pick it carefully.
Couldn't generate a topic
Select Your Champions
Choose one persona for each side of the debate
DEBATE TOPIC
Choose personas with different perspectives for a more dynamic debate.
SIDE A (PRO)
Select debater for this side:
No debate personas available right now.
SIDE B (CON)
Select debater for this side:
No debate personas available right now.
VS
Get ready to make your prediction...
Round of
Claim
Evidence
Stakes
Crossfire Answer
Closing Statement
Claim
Evidence
Stakes
Crossfire Answer
Closing Statement
Your Crossfire Question
Generating arguments...
Who's Got This Round?
Make your prediction before the referee scores
The referee scores both sides on
Correct predictions earn +20 XP
· Press 1 or 2 to pick
Evidence
40%
Logic
30%
Detail
20%
Style
10%
Round Results
Your Pick
Not this time
(%)
Overall Score
/10
Your Pick
Not this time
(%)
Overall Score
/10
Set the Crossfire
Pick the question both personas must answer in the final round
Crafting crossfire questions...
Choosing a question earns +10 XP crossfire bonus
🏆
Total XP Earned
Cred Change
Predictions
Debate Oracle! You called every round!
Sharp Instincts! You know your debaters!
The Coin Flip Strategist! Perfectly balanced!
The Contrarian! Bold predictions!
Inverse Genius! Try betting the opposite next time!
XP Breakdown
Base completion
+20 XP
Rounds played ( rounds x 5 XP)
+ XP
Correct predictions ( correct x 20 XP)
+ XP
Crossfire bonus
+10 XP
Accuracy
%
Prediction History
Round
You picked:
✓
✗
Now try on this story
Keep debating to level up your credibility and unlock achievements
People Involved
Organizations Involved
Solar Energy Industries Association (SEIA)
Trade association
Co-publisher of the Solar Market Insight report
US trade association for the solar industry, tracking installations and market data quarterly.
WM
Wood Mackenzie
Research and consulting firm
Co-author of the Solar Market Insight report
Global energy analysis firm that models US solar capacity forecasts and safe harbour pipelines.
U.S. Department of the Treasury
Federal agency
Issued guidance on Prohibited Foreign Entity provisions
Federal agency that, with the IRS, released partial safe harbour guidance in February 2026.
Timeline
February 2026 September 2026
5 events
Latest: Today
Tap a bar to jump to that date
-
SEIA report shows record Q2 surge
Today ReportReport shows 11.4 GW US solar added in Q2, up 45% year over year.
-
New solar tariffs announced
PolicyTrump signs proclamation imposing a 15% tariff plus minimum import prices on key solar components, effective December 4.
-
Safe harbour deadline passes
PolicyProjects not under construction by this date lose investment and production tax credit eligibility.
-
Q2 begins; utility-scale builds accelerate
MarketDevelopers ramp construction on utility-scale projects ahead of the July 4 safe harbour deadline.
-
Treasury releases safe harbour guidance
RegulatoryTreasury and IRS issue partial guidance on Prohibited Foreign Entity rules, giving projects essential but incomplete clarity on tax credit eligibility.
Scenarios
1
Utility-scale solar holds strong through the 2027 placed-in-service cliff
Likely
Resolves by Q1 2028
Discussed by: Wood Mackenzie, SEIA
Wood Mackenzie forecasts roughly 44 GWdc in annual additions through 2031, underpinned by the 200+ GWdc safe harbored pipeline. The risk is the December 31, 2027 deadline: projects that don't reach commercial operation by then lose credit eligibility. Permitting delays already affect an estimated 30% of the early-stage utility-scale pipeline.
2
Tariffs and trade restrictions trigger a supply chain shakeout
Possible
Resolves by Q2 2027
Discussed by: Wood Mackenzie, PV Tech, industry analysts
The 15% tariff plus minimum import prices on solar components takes effect December 4, 2026. Add to that FCC restrictions on foreign-made inverters and an executive order barring imports from Covered Foreign Entities. Wood Mackenzie says this widens the advantage for fully integrated domestic suppliers but raises financing costs for new cell and wafer capacity.
3
Residential solar returns to growth in 2027
Possible
Resolves by End of 2027
Discussed by: Wood Mackenzie
Residential installations hit a five-year low of 995 MW in Q2 2026 after the Section 25D tax credit expired at the end of 2025. Installers are shifting from cash and loan sales to third-party ownership. Wood Mackenzie expects a 23% contraction in 2026, then growth resumes in 2027 as that transition completes.
Historical Context
3 moments from history that rhyme with this story — and how they unfolded.
2012–2016
Wind PTC deadline rushes (2012–2016)
US wind developers repeatedly rushed projects to completion before production tax credit expiration dates, creating boom-bust cycles. Each deadline brought a surge of new capacity, followed by a sharp dip the next year.
Then
Installations spiked ahead of deadlines, then collapsed, hurting supply chains and financing.
Now
The five-year extension in 2015 broke the cycle, letting wind become cost-competitive with natural gas.
Why this matters now
Solar now faces the same deadline-driven dynamics — but without a long-term extension. The ITC and PTC phase out entirely rather than being extended.
2019–2021
Solar ITC step-down (2020–2021)
The federal investment tax credit stepped down from 30% to 26% at the start of 2020. Developers rushed to qualify projects before each step-down, spiking installations.
Then
A record 2020 for utility-scale solar, followed by a softer 2021.
Now
Solar kept growing as panel costs fell far enough to make the credit less central to project economics.
Why this matters now
It shows the credit's diminishing importance over time — but this phaseout is steeper, ending the credits entirely rather than reducing them.
2022–2023
California NEM 3.0 transition (2023)
California cut rooftop solar export rates by roughly 75% under its Net Energy Metering 3.0 rules. Thousands of homeowners rushed to install systems before the April 2023 cutoff.
Then
Residential installs spiked in early 2023, then fell sharply for about a year.
Now
The market stabilized around third-party ownership and battery pairing as installers adapted.
Why this matters now
It shows the predictable arc of a policy deadline: a front-loaded rush, then a contraction, then a rebalance. Residential solar is now in the contraction phase after the 25D credit expired.
Sources
(11)Related Stories
Solar leads new US power capacity as global installations pass 3 terawatts
Built World
Updated Aug 13
Record U.S. clean power deployment continues as federal support shrinks
Built World
Updated 5 days ago
The death of residential solar tax credits
Rule Changes
Updated May 19
World's solar fleet passes 3 terawatts
Built World
Updated Aug 5
Trump’s permitting crackdown strands U.S. wind and solar boom
Rule Changes
Updated Aug 8
US renewable power contracts hit record prices as policy and data center demand collide
Money Moves
Updated May 31