


Pull to refresh
Logo
Solar leads new US power capacity as global installations pass 3 terawatts

Solar leads new US power capacity as global installations pass 3 terawatts

Built World

Federal data shows solar and batteries made up about 91% of new US grid capacity in early 2026

August 13th, 2026: Analysis details record US solar buildout

Overview

Updated Aug 13

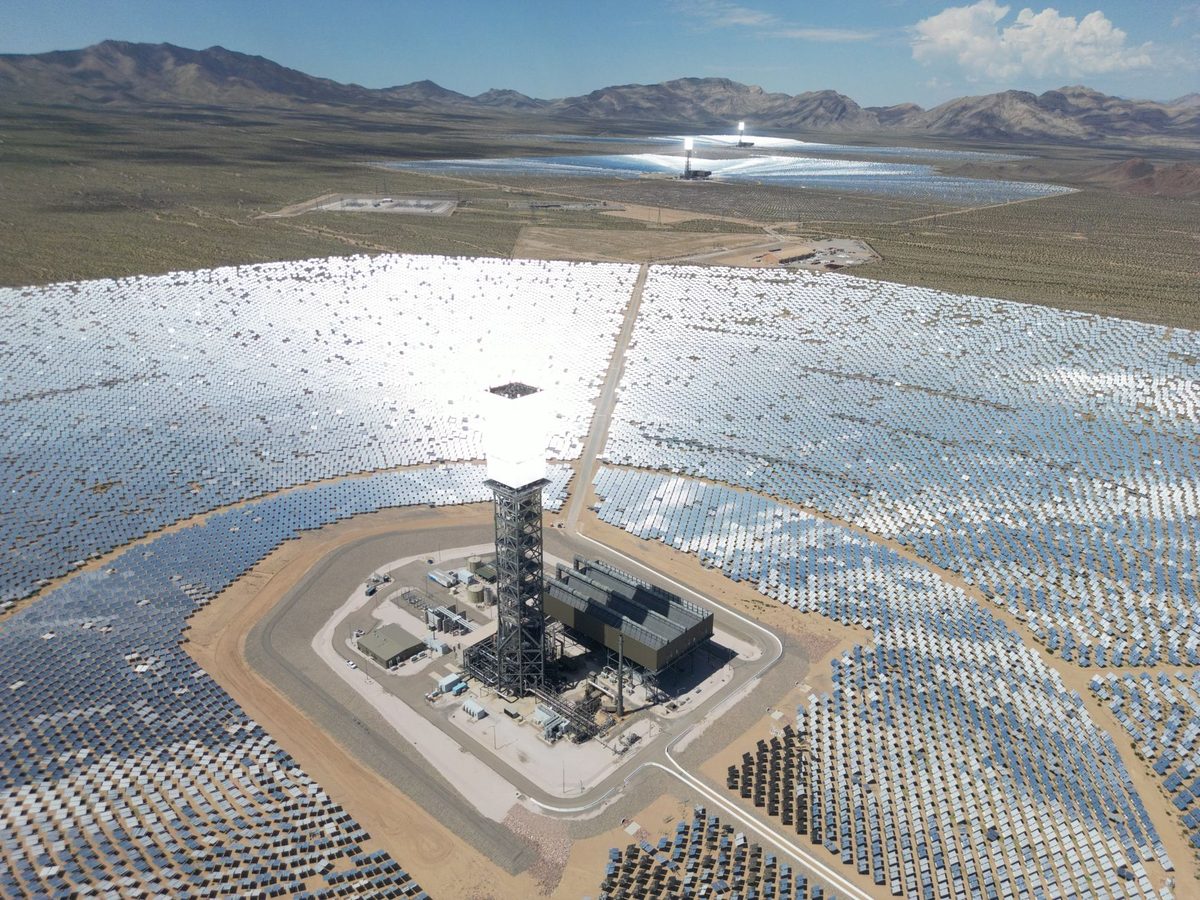
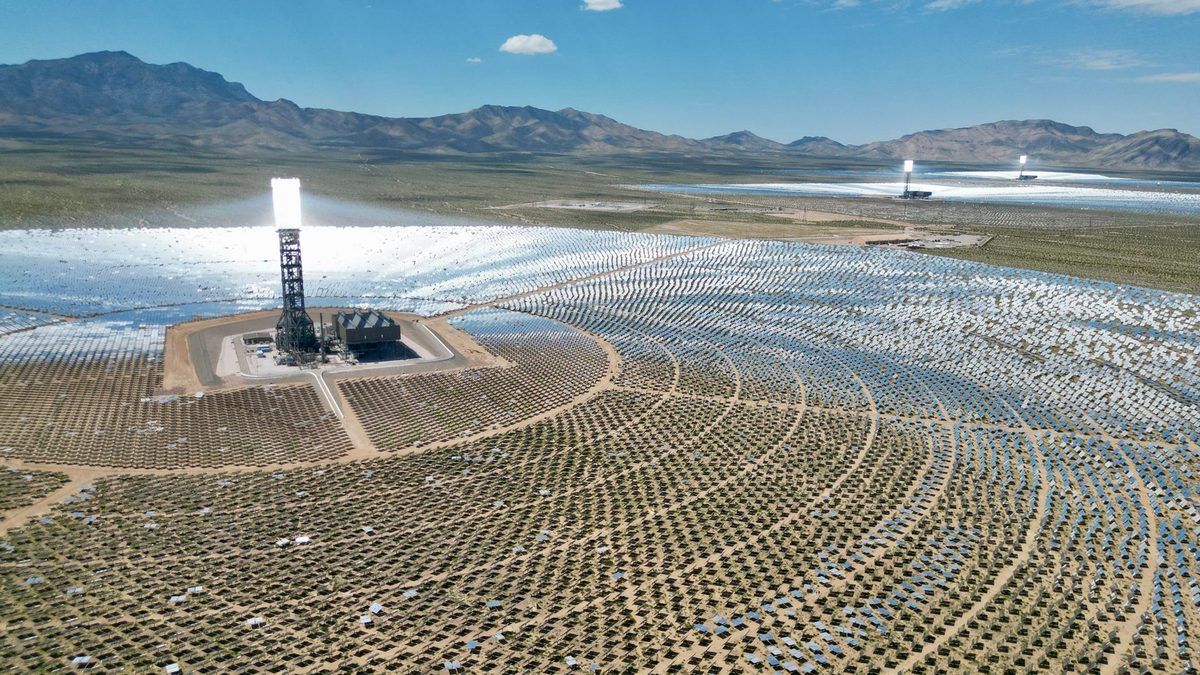
Almost every new power plant that switched on in the United States this year runs on sunlight or stores it. An Inside Climate News review of federal data found that large-scale solar and batteries made up roughly 91% of new grid capacity added in the first part of 2026.

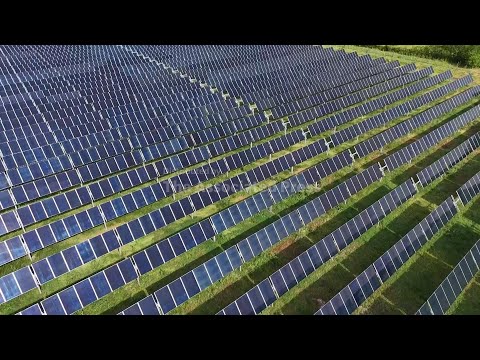
This is now the normal way the country builds electricity supply, not a one-year blip. Utility-scale solar added about 11,458 megawatts in the first half of 2026. The three largest types of natural gas plants added 2,707 megawatts combined.

Why it matters

Solar and batteries now supply most new US electricity, pushing down power costs and changing where new plants get built.

Questions about this story

Free account needed to ask — your question is kept and asked for you right after sign-up. Answers are public.

No questions yet — be the first to ask.

Key Indicators

~91%
Solar + storage share of new US grid capacity
Combined share of new capacity added in the first part of 2026.
11,458 MW
New utility-scale solar, first half 2026
Leading category by capacity, ahead of batteries at 8,207 megawatts.
2,707 MW
New natural gas capacity, first half 2026
The three largest gas plant types combined, well behind solar.
3 TW
Global cumulative solar installed
Worldwide total crossed three terawatts in early 2026.
30%
Renewables share of US generation
All renewables in the first third of 2026, up from 27.8% a year earlier.

Voices

Curated perspectives — historical figures and your fellow readers.

Ever wondered what historical figures would say about today's headlines?

Sign up to generate historical perspectives on this story.

People Involved

Organizations Involved

Timeline

January 2022 August 2026

6 events Latest: August 13th, 2026 · 1 month ago
Tap a bar to jump to that date
  1. Analysis details record US solar buildout

    Latest Analysis

    Inside Climate News reviews federal data on every 2026 US power plant. Solar and batteries make up about 91% of new capacity.

  2. Global solar crosses three terawatts

    Milestone

    Bloomberg reports the world's cumulative solar passed three terawatts, the third added in about 19 months.

  3. Renewables reach 30% of US generation

    Data

    EIA data shows renewables at 30% of US electricity in early 2026, up from 27.8%.

  4. Solar out-generates coal in a month

    Data

    In May, US solar produced 47,147 gigawatt-hours to coal's 45,119, a first.

  5. Second terawatt reached

    Milestone

    Global solar passes two terawatts, about two years after the first.

  6. World hits first terawatt of solar

    Milestone

    Global installed solar reaches one terawatt, nearly 68 years after the first silicon cell.

Scenarios

1

Solar and batteries hold their grip on new US capacity for all of 2026

Likely Resolves by Q1 2027

Discussed by: pv magazine USA, EIA generator inventory forecasts

The first-half pattern holds through December. Grid operators keep connecting solar and battery projects faster than anything else, and gas stays a minor share of new builds. EIA's own outlook points to roughly 86 gigawatts of new capacity in 2026, led by solar and storage. If interconnection queues clear on schedule, the year-end tally looks much like the mid-year one.

2

Global solar passes four terawatts before 2028

Likely Resolves by Jan 1, 2028

Discussed by: BloombergNEF, Global Solar Council

The jump from two to three terawatts took about 19 months. With China still installing 350 to 380 gigawatts a year and other markets growing, forecasters expect the fourth terawatt to arrive even faster. If annual additions stay near 600 to 700 gigawatts, the world clears four terawatts within roughly a year and a half of the third.

3

US solar additions fall in 2027 after federal incentive changes

Possible Resolves by Q2 2028

Discussed by: Beveridge & Diamond legal analysis, Wood Mackenzie/SEIA outlooks

Changes to federal clean-energy tax credits and permitting create headwinds for new projects. Developers pull forward builds into 2026 to lock in support, then annual installations dip the following year. If the policy drag outweighs falling hardware costs, 2027 becomes the first down year for US solar additions in some time.

Historical Context

2 moments from history that rhyme with this story — and how they unfolded.

2010-2012

Germany's solar feed-in tariff boom (2010-2012)

Generous guaranteed prices drove a rush of German solar installs, adding roughly 7 gigawatts a year at the peak. The program also drove up consumer surcharges.

Then

Germany briefly led the world in installed solar and seeded global demand.

Now

Berlin cut the subsidies, installs fell, but the demand had already pushed panel prices down worldwide.

Why this matters now

It is a warning that policy support can pull growth forward and then reverse it, the risk behind the 2027 scenario for US solar.

2016

Natural gas overtakes coal in US generation (2016)

Cheap gas from the shale boom made new combined-cycle plants the default build for over a decade. In 2016, natural gas produced more US electricity than coal for the first full year.

Then

Coal plants retired faster than expected as gas undercut them on price.

Now

Gas became the largest single source of US power and reset what utilities build.

Why this matters now

It shows how a cheaper new technology can dominate new capacity and reorder the grid within a few years. Solar and batteries are now playing that role.

Sources

(7)