


Pull to refresh
Logo
Federal debt held by the public tops the size of the U.S. economy

Federal debt held by the public tops the size of the U.S. economy

Money Moves Interactive

The debt-to-GDP ratio passed 100% in fiscal 2026 for the first time since 1946, with net interest costs setting a record above $1 trillion

Overview

Updated 5 days ago

At the end of September 2026, the federal government owed the public about $32.4 trillion. Over the same 12 months, the economy produced roughly $32.2 trillion, so the debt was larger than the economy for the first time since 1946.

Treasury's final statement for the fiscal year put net interest at $1.05 trillion, a record 3.26% of gross domestic product and more than national defense. Only Social Security and Medicare cost more. Democrats won control of Congress in the November 3 midterms, and investors are watching the next debt-ceiling fight.

Why it matters

Interest now costs more than defense, so every borrowed dollar competes with spending on everything else.

Guess first

In 2007, U.S. debt was 35% of the economy. Guess where it is now.

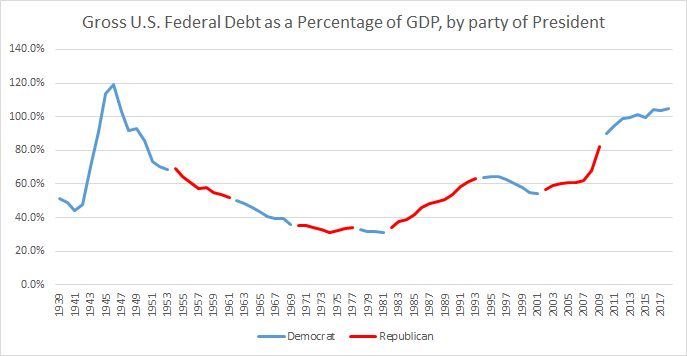
Federal debt held by the public as a share of GDP, each fiscal year since 1940. The line stops at 2007: drag the dot to guess fiscal 2026.

0%50%100% 1960198020002020 1946: war debt, 106% 1974: the low, 23% 2007: 35% 100.6%

fiscal 2026: 100.6%. It nearly tripled in 19 years, most of it in the 2008-2012 slump and the 2020 Covid year. The only years it was higher were 1945 and 1946, at the end of World War II.

In 2007, U.S. debt was 35% of the economy. Guess where it is now. Notes and the latest months; 87 points from 1940 to 2026 at the source.
DateValue
1946106.1%
197423.2%
199647.0%
199744.6%
199841.7%
199938.3%
200033.7%
200131.5%
200232.7%
200334.7%
200435.7%
200535.8%
200635.4%
200735.2%
200839.2%
200952.2%
201060.6%
201165.5%
201270.0%
201371.8%
201473.3%
201572.2%
201676.0%
201775.7%
201877.1%
201978.9%
202098.5%
202196.7%
202294.9%
202395.8%
202497.4%
202599.5%
2026100.6%

As of 2026-11-02. OMB Table 7.1, debt held by the public as % of GDP, fiscal 1940-2025. Fiscal 2026 is our sum: Treasury's Sept. 30 figure ($32.425tn) over BEA GDP averaged over the fiscal year ($32.235tn) = 100.6%. Treasury runs ~0.4% above OMB, so about 100.2% on OMB's basis; CRFB and AAF say about 100%. Sources: OMB Historical Tables, Table 7.1: Federal Debt at the End of Year, U.S. Treasury, Debt to the Penny, BEA, Gross Domestic Product (NIPA Table 1.1.5).

Questions about this story

Free account needed to ask — your question is kept and asked for you right after sign-up. Answers are public.

No questions yet — be the first to ask.

Key Indicators

About 100%
Debt held by the public as a share of GDP
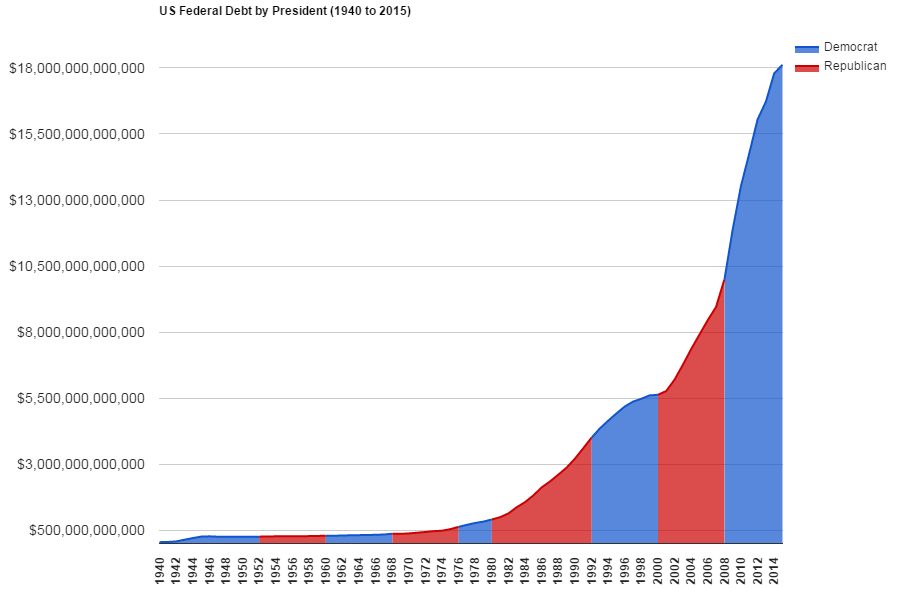
Fiscal 2026 ratio, up from 99.4% in fiscal 2025.
$32.4T
Debt held by the public
Money the Treasury owes to banks, state and local governments, and foreign holders.
$40.5T
Total national debt
Includes debt the government owes to its own trust funds.
$1.99T
Fiscal 2026 budget deficit
Treasury's final statement put the deficit at $1.99 trillion.
$1.05T
Net interest paid
A record 3.26% of GDP, more than national defense.
$41.1T
Statutory debt limit
Set in 2025; Treasury is projected to reach it by midsummer 2027.
106%
Record debt-to-GDP ratio, 1946
The World War II peak that the current ratio is now approaching.

Voices

Curated perspectives — historical figures and your fellow readers.

Sign up to generate historical perspectives on this story.

People Involved

Organizations Involved

Timeline

January 2025 November 2026

9 events Latest: November 3rd, 2026 · 1 week ago
Tap a bar to jump to that date
  1. Net interest on the national debt tops $1 trillion

    Latest Data release

    Treasury's final monthly statement for fiscal 2026 put net interest at $1,051.8 billion, up 8.4% from a year earlier and a record 3.26% of GDP.

  2. Democrats win control of Congress in midterms

    Election

    Democrats took the Senate and House, setting up a fight over the debt ceiling that Treasury is projected to reach in 2027.

  3. The Hill reports the fiscal 2026 milestone

    Coverage

    The report tied the ratio to record interest costs and rising bond yields during the Iran war.

  4. GDP data confirms the debt ratio passed 100%

    Data release

    Bureau of Economic Analysis figures put the fiscal 2026 debt-to-GDP ratio at about 100%, the first time since 1946.

  5. Fiscal 2026 closes with $32.4 trillion owed to the public

    Fiscal

    The fiscal year ended with publicly held debt above the roughly $32.2 trillion the economy produced over the same period.

  6. Total national debt crosses $40 trillion

    Milestone

    Treasury reported total public debt outstanding above $40 trillion, roughly double the figure from January 2017.

  7. CBO projects debt at 101% of GDP

    Forecast

    The agency also projected the ratio would reach 120% by 2036, passing the 1946 record of 106%.

  8. One Big Beautiful Bill Act raises the debt limit

    Legislation

    The law lifted the statutory debt ceiling to $41 trillion from $36 trillion; the Congressional Budget Office estimated it would add $4.7 trillion to debt through 2035.

  9. Trump takes office with $36.2 trillion in total debt

    Background

    The total national debt stood at roughly $36.2 trillion when the second term began, up from about $19.95 trillion in January 2017.

Scenarios

1

Debt ratio climbs again in fiscal 2027

Likely Resolves by Oct 29, 2027

Discussed by: Congressional Budget Office baseline projections and Committee for a Responsible Federal Budget estimates

Deficits have run near 6% of GDP, and the Congressional Budget Office expects the ratio to keep rising for a decade. If borrowing stays at that level and growth slows from the 3.4% annual rate recorded in the third quarter of 2026, the ratio ends fiscal 2027 above its current level.

2

Congress enacts a deficit-reduction package

Unlikely Resolves by Q3 2027

Discussed by: Fiscal policy groups including the Committee for a Responsible Federal Budget

A law cutting spending or raising revenue by enough to change the debt trajectory would need to pass a divided Congress in an election year. The trigger would be a budget reconciliation bill or a bipartisan fiscal commission package reaching the floor.

3

The 30-year Treasury yield closes above 6%

Possible Resolves by End of 2027

Discussed by: Bond market analysts cited by The Hill

The 30-year yield was near 5.31% in late October 2026, up roughly 68 basis points since the Iran conflict began. Continued heavy issuance and inflation concerns could push long-term borrowing costs past 6%, raising the government's own interest bill further.

4

Debt-ceiling standoff runs into 2027

Possible Resolves by End of 2027

Discussed by: Michael Reynolds of Glenmede, Dustin Reid of Mackenzie Financial, BMO's Vail Hartman and the Bipartisan Policy Center

Democrats won control of Congress and can use the borrowing limit as leverage in budget talks with President Trump. The Bipartisan Policy Center expects Treasury to hit its $41.1 trillion cap by midsummer 2027, with the X-date possibly in the fourth quarter. Analysts call a default unlikely but say a protracted fight could prompt downgrades and rattle cash and repo markets.

Historical Context

3 moments from history that rhyme with this story — and how they unfolded.

1946

World War II debt peak (1946)

Federal borrowing to fight World War II pushed debt held by the public to 106% of GDP, the highest ratio in U.S. history. The war ended the year before, and the government was still carrying the cost.

Then

Debt stayed large while the economy demobilized and spending fell.

Now

Fast postwar growth and balanced budgets cut the ratio for three decades, which is why 106% stood as the record.

Why this matters now

The Congressional Budget Office projects today's ratio will pass that 1946 record, reaching 120% by 2036.

1998–2001

Budget surplus and the dot-com boom (1998–2001)

Economic growth, spending restraint and tax revenue from the dot-com expansion produced federal budget surpluses. By 2000, debt held by the public had fallen to 33.7% of GDP and was still declining.

Then

The government briefly projected surpluses as far as forecasts went.

Now

The reversal came quickly: tax cuts, wars and two recessions pushed the ratio back up within a decade.

Why this matters now

It is the clearest recent evidence that the ratio can fall without a crisis, through growth and revenue rather than default.

2008–2021

Financial crisis and pandemic borrowing (2008–2021)

Emergency spending after the 2008 financial crisis and during the COVID-19 pandemic added trillions to the debt in short bursts. Spending on Social Security and Medicare also rose as the population aged.

Then

Deficits spiked, then fell back as emergency programs expired.

Now

The debt level never returned to its pre-crisis path; each episode left a permanently higher baseline.

Why this matters now

Today's ratio reflects the compounding of those episodes, plus the interest costs they created.

Sources

(11)