



Pull to refresh
Logo
UK house price growth slows to weakest pace since January 2024

UK house price growth slows to weakest pace since January 2024

Money Moves Interactive

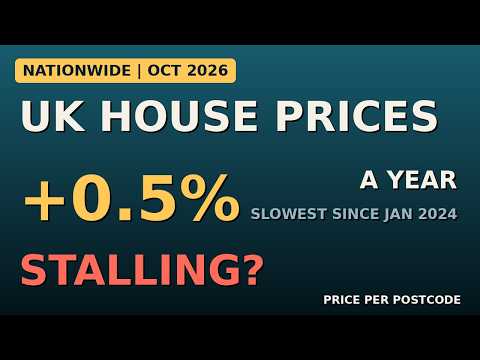
Annual growth fell to 0.5% in October, while a separate Lloyds measure showed the biggest annual fall since October 2023.

Overview

Updated 5 days ago

British house prices were flat in October and annual growth slowed to 0.5%, the weakest since January 2024, according to Nationwide. A separate Lloyds reading on 6 November showed the biggest annual fall since October 2023.

The pressure comes from the Middle East conflict, which pushed up energy prices and led investors to bet on higher Bank of England rates. Mortgage rates have climbed to three-year highs, and more than 2.3 million households are due to refinance in 2027. The Bank of England was widely expected to raise Bank Rate to 4% on 5 November; the outcome was not reported.

Why it matters

Higher mortgage costs cut buyers' budgets and leave sellers facing longer waits and lower offers.

Ten years of house prices

In ten years, London house prices rose less than in any other UK region

Average house price change since August 2016 in the UK's 12 regions. London has been last every year since 2018. Northern Ireland now leads, up 71.5%.

London in 2026: 9.7%. Ranks 12 of 12.

In ten years, London house prices rose less than in any other UK region (%)
NameData pointsSource
Northern Ireland2017: 3.3; 2018: 7.9; 2019: 12.1; 2020: 15.2; 2021: 27.6; 2022: 40.9; 2023: 43.8; 2024: 52.9; 2025: 63.6; 2026: 71.5HM Land Registry, UK House Price Index
North West2017: 5.4; 2018: 8.6; 2019: 11.7; 2020: 15.4; 2021: 27.7; 2022: 43.7; 2023: 43.4; 2024: 48.4; 2025: 54.3; 2026: 57.7HM Land Registry, UK House Price Index
Wales2017: 5.1; 2018: 10.8; 2019: 15.7; 2020: 19.0; 2021: 31.0; 2022: 48.4; 2023: 48.1; 2024: 50.5; 2025: 52.4; 2026: 57.2HM Land Registry, UK House Price Index
West Midlands2017: 6.7; 2018: 11.9; 2019: 14.2; 2020: 17.4; 2021: 30.5; 2022: 42.9; 2023: 43.3; 2024: 45.6; 2025: 48.5; 2026: 51.4HM Land Registry, UK House Price Index
Yorkshire and the Humber2017: 4.4; 2018: 8.3; 2019: 9.3; 2020: 12.9; 2021: 22.7; 2022: 37.1; 2023: 38.7; 2024: 41.7; 2025: 44.1; 2026: 46.8HM Land Registry, UK House Price Index
Scotland2017: 4.5; 2018: 8.0; 2019: 9.5; 2020: 9.8; 2021: 25.9; 2022: 35.3; 2023: 34.7; 2024: 37.4; 2025: 42.2; 2026: 46.3HM Land Registry, UK House Price Index
East Midlands2017: 5.9; 2018: 11.6; 2019: 13.1; 2020: 16.4; 2021: 25.9; 2022: 42.6; 2023: 41.9; 2024: 40.9; 2025: 44.8; 2026: 45.5HM Land Registry, UK House Price Index
North East2017: 2.9; 2018: 3.4; 2019: 4.2; 2020: 4.3; 2021: 14.8; 2022: 27.2; 2023: 29.4; 2024: 28.5; 2025: 34.5; 2026: 38.8HM Land Registry, UK House Price Index
South West2017: 5.7; 2018: 9.1; 2019: 9.1; 2020: 12.0; 2021: 19.2; 2022: 37.5; 2023: 34.4; 2024: 32.6; 2025: 33.1; 2026: 33.1HM Land Registry, UK House Price Index
East of England2017: 6.0; 2018: 8.4; 2019: 7.1; 2020: 9.2; 2021: 15.5; 2022: 28.3; 2023: 25.2; 2024: 23.9; 2025: 25.7; 2026: 25.9HM Land Registry, UK House Price Index
South East2017: 4.2; 2018: 5.8; 2019: 4.1; 2020: 6.3; 2021: 12.3; 2022: 25.1; 2023: 22.2; 2024: 22.3; 2025: 22.6; 2026: 21.7HM Land Registry, UK House Price Index
London2017: 3.2; 2018: 1.6; 2019: 0.2; 2020: 3.7; 2021: 8.0; 2022: 15.1; 2023: 11.0; 2024: 12.2; 2025: 12.2; 2026: 9.7HM Land Registry, UK House Price Index

As of 2026-11-07. HM Land Registry UK House Price Index: each region's average price in August of each year, not seasonally adjusted, against August 2016. August 2026 is the latest month. Not adjusted for inflation; recent months get revised. Sources: HM Land Registry, UK House Price Index.

Questions about this story

Free account needed to ask — your question is kept and asked for you right after sign-up. Answers are public.

No questions yet — be the first to ask.

Key Indicators

0.5%
Annual house price growth
Nationwide's measure for October, down from 0.8% in September.
0.0%
Monthly price change
Prices were flat month on month after seasonal adjustment.
£273,566
Average UK house price
Nationwide's non-seasonally adjusted average for October.
3.75%
Bank of England Bank Rate before 5 November
Held at 3.75% since December 2025; markets expected a rise to 4% at the 5 November meeting.
5.99%
Average five-year fixed mortgage rate
Moneyfacts data for late October; a 4 November report said five-year rates had breached 6%.
35%
Homes in postcodes with annual price falls
Zoopla estimate for September, up from 12% a year earlier.
Biggest fall since Oct 2023
Lloyds annual house price change
Lloyds reported on 6 November that UK house prices posted their biggest annual fall since October 2023.

Voices

Curated perspectives — historical figures and your fellow readers.

Sign up to generate historical perspectives on this story.

People Involved

Organizations Involved

Timeline

February 2026 November 2026

7 events Latest: 5 days ago
Tap a bar to jump to that date
  1. Lloyds reports biggest annual house price fall since October 2023

    Latest Data

    Lloyds said UK house prices posted their biggest annual fall since October 2023, a separate measure from Nationwide's 0.5% annual growth.

  2. Mortgage rates hit three-year high before Bank vote

    Data

    Moneyfacts data reported by Yahoo Finance showed the average mortgage rate at 5.89%, the highest since November 2023, with five-year fixes above 6%.

  3. Nationwide reports 0.5% annual growth

    Data

    Annual house price growth slows to its weakest since January 2024; prices are flat month on month.

  4. OBR cuts house price forecast

    Forecast

    The fiscal watchdog lowers its 2026 growth forecast to 2.1% after the Autumn Budget.

  5. Mortgage approvals fall to lowest since December 2023

    Data

    Bank of England data show fewer mortgages approved for house purchase in September.

  6. Annual house price growth peaks at 3.0%

    Data

    Nationwide records the high point of the year before growth begins to fade.

  7. Middle East conflict begins

    Geopolitical

    The conflict pushes up energy prices and leads markets to abandon bets on Bank of England rate cuts.

Scenarios

1

Bank of England raises Bank Rate to 4%

Deadline passed (Nov 6, 2026)

Discussed by: Reuters poll of economists; market pricing reported by Nationwide

Most economists expect the Monetary Policy Committee to raise Bank Rate to 4% from 3.75% at its November meeting, the first increase in three years. A hike would keep upward pressure on mortgage rates and reinforce the cooling in buyer demand.

2

UK house prices fall year-on-year by spring 2027

Possible Resolves by Q1 2027

Discussed by: Ashley Webb of Capital Economics

Capital Economics expects mortgage rates to keep rising and prices to fall further in coming months. If correct, Nationwide's annual growth rate would turn negative, echoing the 2022-2023 downturn.

3

Housing market regains momentum as energy shock fades

Unlikely Resolves by Q2 2027

Discussed by: Robert Gardner of Nationwide

Gardner argues that once the energy shock fades, solid employment, rising real incomes and improved affordability should support a rebound. That would require mortgage rates to stabilize and buyer enquiries to recover.

Historical Context

2 moments from history that rhyme with this story — and how they unfolded.

September-October 2022

UK mini-budget mortgage shock (2022)

The Truss government's unfunded tax cuts sent gilt yields sharply higher and prompted lenders to pull mortgage products. Average fixed mortgage rates jumped within weeks.

Then

The Bank of England intervened in the gilt market, the mini-budget was largely reversed and the prime minister resigned.

Now

Mortgage pricing tracked the funding market ever more closely, and house price growth turned negative in 2023.

Why this matters now

It shows how fast a shift in rate expectations reaches household mortgage costs, the same channel now at work.

1988-1995

Late-1980s boom and early-1990s housing slump

A credit boom and tax incentives pushed house prices up fast in the late 1980s. When interest rates were raised sharply, prices fell and many borrowers were left in negative equity.

Then

Prices fell through the early 1990s and transactions stalled.

Now

It took years for prices to recover, and negative equity shaped household finances for a decade.

Why this matters now

A reminder that rate-driven housing downturns can outlast the rate spike that caused them.

Sources

(13)