It looks like since 2020 it was dramatically reduced. What are the primary reasons for that?
The drop since 2011—steepest on paper after 2022—comes mainly from strong consumption growth, rising employment among women, and expanded food and cash transfers, with better survey measurement adding to the apparent post-2020 decline.
How much of the fall is real versus statistical determines where India should focus next: productive jobs and social protection in its poorest states.
4 details4 sources2 disagreements
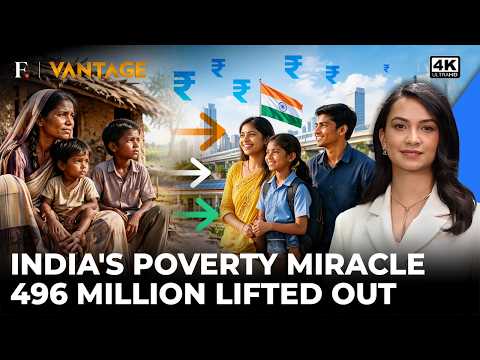
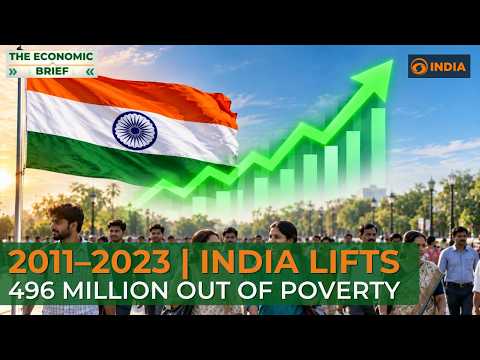
- Between 2011-12 and 2023-24, the share of Indians below $4.20 a day fell from 57.7% to 16.1%, lifting about 496 million people above that line; extreme poverty at $3 a day fell from 27.1% to 2.6%.
- The World Bank credits strong consumption growth, rising employment—especially rural women entering paid work—and expanded social transfers including food subsidies.
- The one-year drop from 24% in 2022-23 to 16.1% in 2023-24 is unusually large; the bank says it likely reflects both genuine welfare gains and better survey measurement.
- Non-monetary poverty also fell sharply: multidimensional poverty dropped from 53.8% in 2005-06 to 16.4% in 2019-21, with the World Bank's MPI at 15.5% in 2022-23.
Room for disagreement
- The World Bank's own technical note warns the 2011-12 and 2022-23 surveys are not strictly comparable; some analysts argue questionnaire and sampling changes inflate the measured decline.
- EPW researchers describe the fall as broadly inclusive, while others point out that wage disparities remain extreme—the top 10% of earners make about 13 times the bottom 10%—so gains are unevenly shared.
0
AI answers with web search. May be wrong.